Teacher Preparation, Pre-College Human Capital and Student Learning: Evidence from Enseña Chile
Abstract
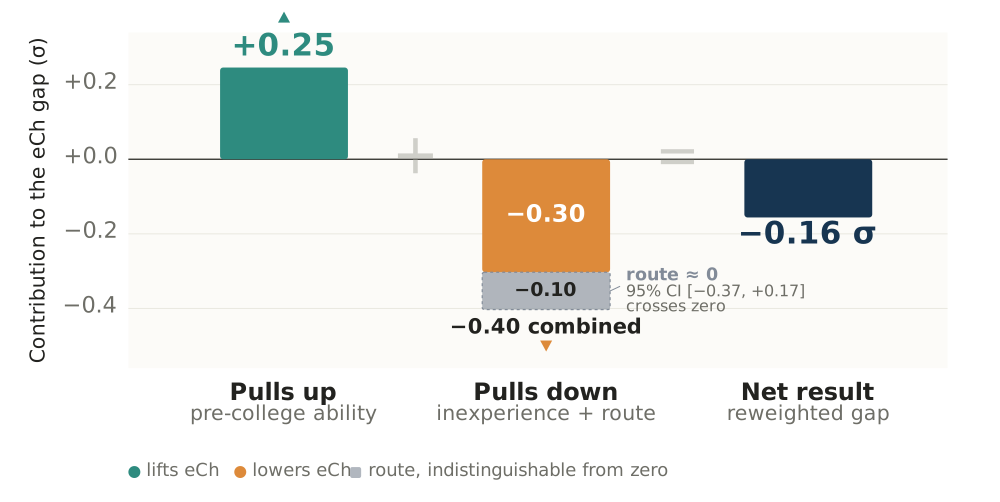
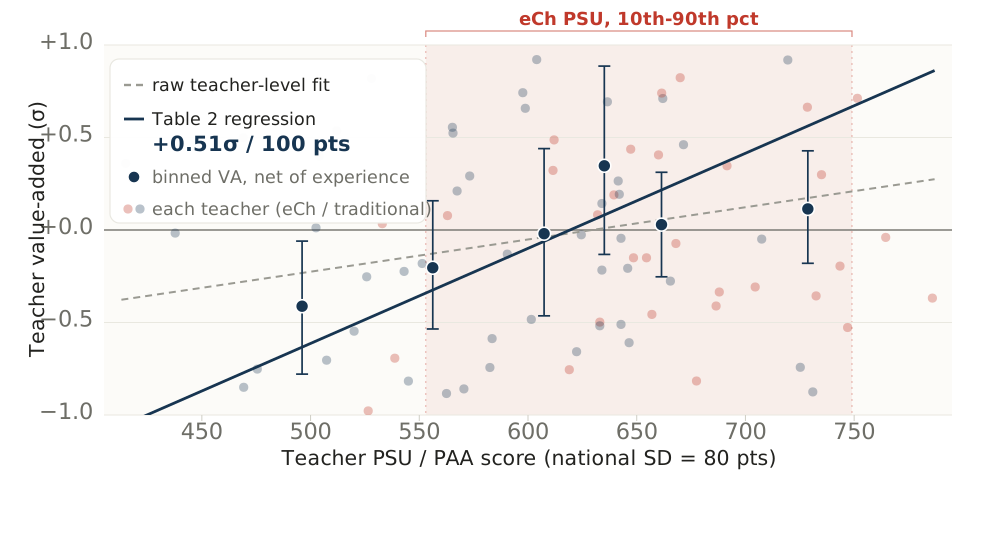
Teacher value-added is rarely estimated in middle-income countries, which lack the repeated classroom-level testing it requires. We administered baseline and end-of-year mathematics tests in Chilean classrooms and linked the resulting estimates to teachers' pre-college admission scores, experience, and preparation route. We compare Enseña Chile, the Chilean Teach For All affiliate, with traditional teacher-college preparation. A one-SD (σ) higher admission score predicts 0.41σ higher value-added. Enseña Chile teachers gain +0.25σ from ability but trail traditional teachers by 0.16σ after reweighting, driven by inexperience. Training routes are statistically indistinguishable. High-ability recruits help only if they stay long enough to gain experience.
Soledad De Gregorio, Christopher A. Neilson, Sebastián Gallegos, "Teacher Preparation, Pre-College Human Capital and Student Learning: Evidence from Enseña Chile", 2026.
@techreport{DeGregorioNeilsonGallegos2026_eCh,
  author = {De Gregorio, Soledad and Neilson, Christopher A. and Gallegos, Sebasti\'an},
  title  = {Teacher Preparation, Pre-College Human Capital and Student Learning: Evidence from Ense\~{n}a Chile},
  year   = {2026},
  month  = {August},
  type   = {Working Paper},
  url    = {https://www.christopher-neilson.com/work/eCh_Teachers.html}
}
Key Figures
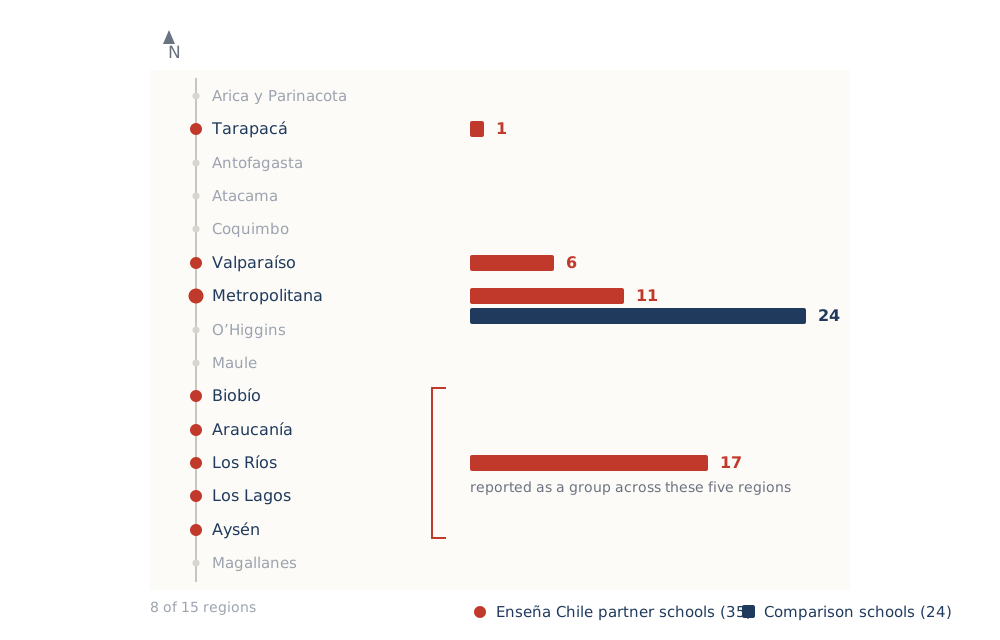
The design in brief
We ran the testing campaign the study needed rather than relying on an existing panel. The SEPA mathematics assessment was administered at the start (May) and end (November) of the 2016 school year across 169 classrooms in grades 9–11, covering 3,756 students and 114 mathematics teachers (37 Enseña Chile, 77 traditionally prepared) in 59 schools. Those value-added estimates were then linked to two administrative sources: teachers’ PSU/PAA university entrance scores from DEMRE, and years of service from the Ministry of Education’s Docentes panel.
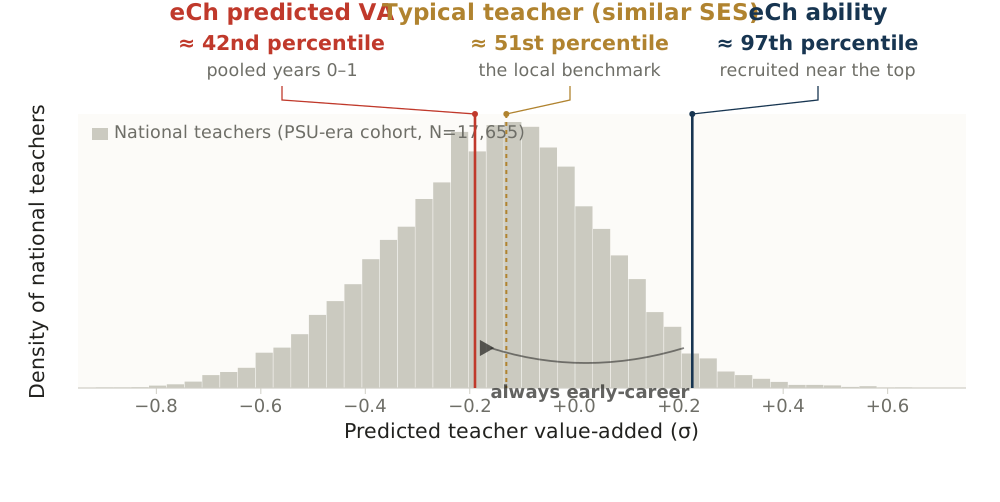
The comparison group is deliberately not representative. Enseña Chile recruits come from selective universities and cluster at the top of the entrance-score distribution, so a nationally representative comparison would confound preparation route with academic ability. We instead stratified non-partner schools by their teachers’ PSU decile and invited at least one school per decile, buying the ability overlap needed to estimate the gradient at the cost of representativeness. Group means are therefore analytic-sample comparisons; the headline decomposition reweights the sampled traditional teachers to the national common-support PSU distribution.
How learning was measured
The study rests on a testing campaign the research team ran itself, rather than on an existing panel. Chile’s national assessment, SIMCE, is not designed to follow the same students across a school year, so it cannot separate what a teacher added from what students arrived with. The team instead used SEPA (Sistema de Evaluación de Progreso del Aprendizaje), the learning-progress assessment developed by MIDE-UC, the measurement centre at the Pontificia Universidad Católica de Chile, administered by external proctors at the start of the 2016 school year in May and again at the end in November. That baseline-and-endline design across 169 classrooms in grades 9–11 is what makes teacher value-added estimable here at all — and it is why value-added estimates remain rare across middle-income countries, where the repeated classroom-level testing they require usually does not exist.
Value-added is then constructed following Chetty, Friedman and Rockoff, using those
authors’ vam implementation. Scores are residualised on school and class covariates
— region, municipal dependency, school SES tier, and class size — with teacher
effects estimated from within-teacher variation across the two waves; class-level
follow-up residuals are projected on baseline class residuals, and the predicted residual
learning is standardised across the teachers in the analytic sample.
Two features of that construction matter for reading every number on this page. The estimates are unshrunk, so one σ is one standard deviation of the estimated teacher-effect distribution, not of true teacher quality. And with a single year of data those estimates carry classroom-level noise, which inflates that standard deviation. The effect is to pull the reported gradients toward zero: the 0.41σ ability gradient is conservative, not inflated.
What the paper does not show
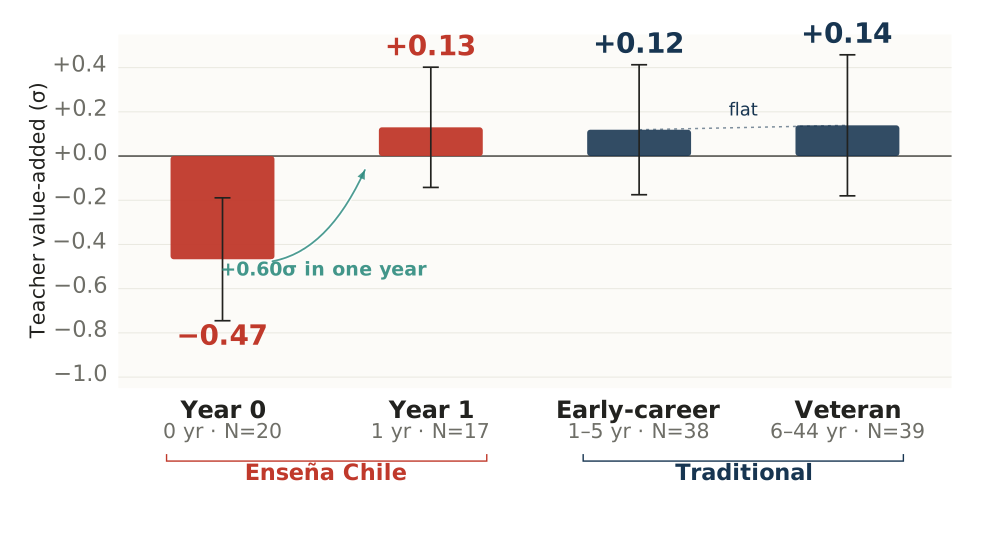
The decomposition is descriptive, not causal, and three limits are worth stating plainly. Value-added is estimated as cross-sectional teacher effects from a single school year, and reported unshrunk — so one σ is one standard deviation of the estimated teacher-effect distribution, which estimation error inflates, making the reported gradients conservative rather than overstated. The first-to-second-year improvement compares two small cohorts (20 and 17 teachers) observed in the same testing wave, so it cannot fully separate learning on the job from cohort composition or differential attrition. And the route residual is imprecise: the data are consistent with ability plus early-career learning accounting for the entire gap, but they cannot rule out a moderate route shortfall. The result is best read as a failure to detect a route penalty rather than as evidence of equivalence.
Materials
This paper is part of the Policies that Recruit, Retain and Promote Teacher Talent project, which sets it alongside the rest of that agenda.
The paper has a companion project site that carries the material this page cannot: the findings figure by figure with a “what this does not show” note against each, the study design written for non-econometricians, an honest limitations FAQ, and an interactive walk through the decomposition. It is available in English and Spanish.
The manuscript and online appendix are linked above. A teaching slide deck is available for classroom use, with the LaTeX source provided so instructors can adapt it. The individual-level records are governed by data-sharing agreements with MIDE-UC, MINEDUC/DEMRE, and Enseña Chile and cannot be redistributed; the replication package, including the aggregate data behind every table and figure, is available from the authors on request.
The team


- Coauthors: ,
- Date: 2026